NEAR price chart
NEAR price today
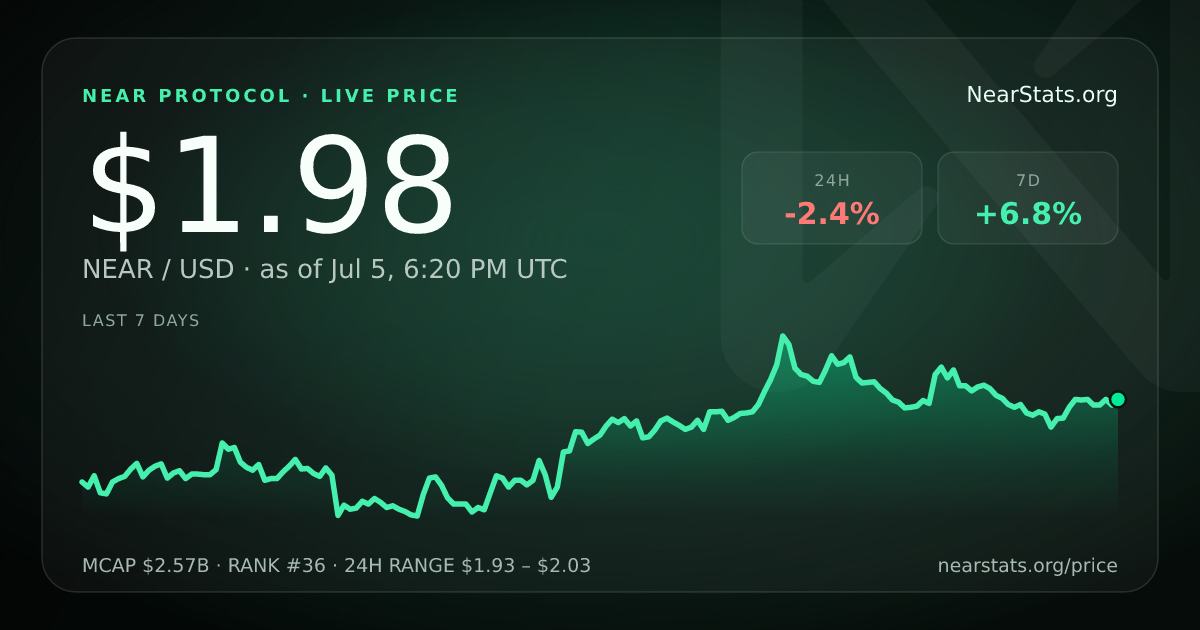
NEAR Protocol (NEAR) is trading at $1.97 as of 2026-07-05 17:20 UTC, down 2.6% over the last 24 hours (24h range $1.93 – $2.03).
Market capitalization is $2.56B (rank #36), with effectively 100% of supply circulating — fully diluted value equals market cap, so there is no unlock overhang. Price history on this page is computed from daily exchange closes stored in the NearStats database.
NEAR market stats
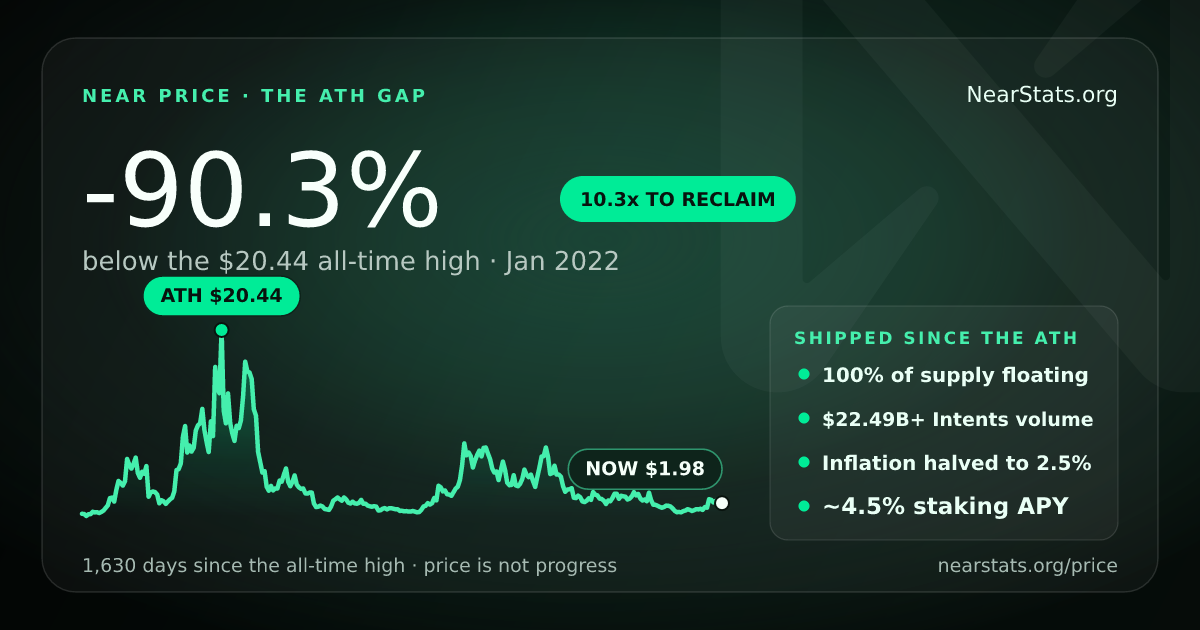
NEAR all time high
NEAR peaked at $20.44 on 2022-01-16 22:09 UTC — 1,630 days ago. From $1.97 that is -90.4% away, a 10.4x move to reclaim. Both numbers are true at once — read it whichever direction you trade.
1 NEAR to USD
| NEAR | USD |
|---|---|
| 0.5 NEAR | $0.9850 |
| 1 NEAR | $1.97 |
| 5 NEAR | $9.85 |
| 10 NEAR | $19.70 |
| 100 NEAR | $197.00 |
| 1000 NEAR | $1,970.00 |
| USD | NEAR |
|---|---|
| $1 | 0.51 NEAR |
| $10 | 5.08 NEAR |
| $100 | 50.76 NEAR |
| $1,000 | 507.61 NEAR |
If NEAR hits $5, $10, or $20.44 again
No predictions here — just arithmetic. Implied market cap = target price × 1,300,041,765 circulating NEAR. Whether a target is realistic is your call; the math is ours.
| Target price | Implied market cap | Multiple from today | Context |
|---|---|---|---|
| $5.00 | $6.50B | 2.5x | inside the top-40 today |
| $10.00 | $13.00B | 5.1x | roughly top-25 today |
| $20.44 | $26.57B | 10.4x | roughly top-15 today |
| $50.00 | $65.00B | 25.4x | roughly top-15 today |
NEAR price performance
| Window | In USD | vs BTC | vs ETH |
|---|---|---|---|
| 7 days | +5.9% | +2.1% | -4.9% |
| 30 days | +0.1% | -2.5% | -10.8% |
| 90 days | +57.9% | +73.5% | +87.4% |
| Year to date | +21.1% | — | — |
| 1 year | -8.3% | +58.3% | +30.0% |
| Since Oct 2020 | +68.6% | — | — |
Denominators matter: over the trailing year NEAR is -8.3% in USD but +58.3% against BTC and +30.0% against ETH.
Calendar-year returns
| Year | Return |
|---|---|
| 2026 (YTD) | +30.1% |
| 2025 | -69.2% |
| 2024 | +34.6% |
| 2023 | +190.6% |
| 2022 | -91.4% |
| 2021 | +950.9% |
| 2020 | +19.1% |
If you bought $100 of NEAR
The same $100, four different entry points. Cuts both ways — that is the point.
| Bought at | $100 today | Multiple |
|---|---|---|
| Aug 2020 CoinList sale ($0.29–$0.40) | $493 – $679 | 4.9x – 6.8x |
| All-time low ($0.5268, Nov 2020) | $374 | 3.7x |
| All-time high ($20.44, Jan 2022) | $10 | 0.10x |
| One year ago ($2.15) | $92 | 0.92x |
NEAR price vs NEAR Intents volume
Price is the market's opinion; usage is a fact. NEAR is -8.3% over 12 months while NEAR Intents has settled $22.49B in cross-chain swaps all-time and generated $37.2M in cumulative fees. The two curves are tracked separately on NearStats — live volume stats, what NEAR Intents is.
NEAR supply and tokenomics
NEAR's float is effectively 100%: circulating supply (1,300,041,765 NEAR) equals total supply, so market cap and fully-diluted value are the same number. There is no venture-unlock overhang repricing the chart.
Inflation was halved from 5% to 2.5% in October 2025 ("NEAR's first halving"), and staking currently yields roughly 4.5% APY — meaning staked NEAR out-earns issuance in real terms.
NEAR price history
| Month | Close | Change |
|---|---|---|
| Jul 2026 | $1.97 | +10.5% |
| Jun 2026 | $1.78 | -23.2% |
| May 2026 | $2.32 | +78.9% |
| Apr 2026 | $1.30 | +9.1% |
| Mar 2026 | $1.19 | +1.5% |
| Feb 2026 | $1.17 | -2.8% |
| Jan 2026 | $1.21 | -20.3% |
| Dec 2025 | $1.51 | -16.1% |
| Nov 2025 | $1.81 | -14.0% |
| Oct 2025 | $2.10 | -20.2% |
| Sep 2025 | $2.63 | +11.1% |
| Aug 2025 | $2.37 | -6.6% |
Full daily history since October 2020 backs this page — the chart's ALL view draws every week since NEAR listed. Machine-readable series: /api/near/price-history.
Frequently asked questions
- What is the price of NEAR today?
- NEAR trades at $1.97, down 2.6% over the last 24 hours. NearStats refreshes market data continuously from CoinGecko and exchange closes.
- What is NEAR's all-time high?
- NEAR's all-time high is $20.44, set on January 16, 2022. From $1.97 that is 90.4% below the peak — a 10.4x move to reclaim it.
- What was NEAR's lowest price?
- The all-time low was about $0.53 in November 2020, a few months after the August 2020 CoinList sale priced NEAR at $0.29–$0.40 per token.
- How much is 1 NEAR in USD?
- 1 NEAR equals $1.97. The converter on this page handles any amount in both directions.
- How many NEAR tokens are there?
- About 1,300 million NEAR are circulating, effectively equal to total supply — so fully-diluted value equals market cap and there is no unlock overhang. Annual inflation was halved to 2.5% in October 2025.
- Will NEAR reach $20 again?
- NearStats does not publish price predictions. The arithmetic: reclaiming the $20.44 all-time high from $1.97 is a 10.4x move, implying roughly a $26B market cap — top-15 territory today. The implied-market-cap table above runs the same math for any target.
- What is NEAR's staking yield?
- Staking NEAR currently yields roughly 4.5% APY against 2.5% annual inflation, so staked NEAR out-earns issuance.
- Is NEAR's price the same as NEAR Intents volume?
- No. Price is the market's valuation of the NEAR token; NEAR Intents volume measures actual cross-chain swap usage settled by the protocol. NearStats tracks both, and they often diverge.
Sources
Market data: CoinGecko (live facts, refreshed hourly) and Binance daily closes stored in the NearStats database since October 2020, cross-checked against DefiLlama. Protocol data: NEAR RPC and NearBlocks. Methodology: how NearStats measures data. Nothing on this page is investment advice.
Share the live price card · Post on X